Help
The Aromatic Cage Database (AroCageDB) is a resource that could be used to explore the ligand binding space of aromatic cage containing proteins (ACCPs), as well as for the training of docking scoring functions specific to aromatic cages. Comments about the data are welcome and should be sent to stefan.guenther@pharmazie.uni-freiburg.de.- What is an aromatic cage?
- What is AroCageDB?
- Where does AroCageDB's content comes from?
- Search tips
- Browse
- What is shape and stereochemical complexity?
- How are pocket descriptors calculated?
- Why pocket descriptors on some complex cards are displayed as 'None'?
- Why some downloaded PyMOL session files (PSE) do not show pocket in mesh?
- How are pocket similarities calculated?
- What are the different third party plugins used?
- Whom should I contact with questions or suggestions?
- How do I cite AroCageDB?
What is an aromatic cage?
An aromatic cage, also known as aromatic box or hydrophobic box, is a structural motif lined by two to five closely packed aromatic amino acid residues (Phe, Tyr, Trp, or His) in a highly hydrophobic binding site, often supplemented by a proximal anionic Asp or Glu residue(s). In proteins possessing aromatic cage domains, the specificity of molecular recognition is principally driven by multivalent cation−π interactions formed at the contact interface between a ligand’s cationic center and the aromatic cage residues and, to a lesser extent, by hydrophobic contacts.
What is AroCageDB?
AroCageDB is a comprehensive, manually curated collection of aromatic cage structures from the Protein Data Bank (PDB, https://www.rcsb.org/), analyzed for protein structure, binding pocket, and ligand recognition studies.
Where does AroCageDB's content comes from?
All structures were curated from the PDB (https://www.rcsb.org/).
Search tips
AroCageDB offers several ways to search and explore the database. You can start a search by clicking on one of the six main icons on the homepage or by navigating the Search section of the task bar.
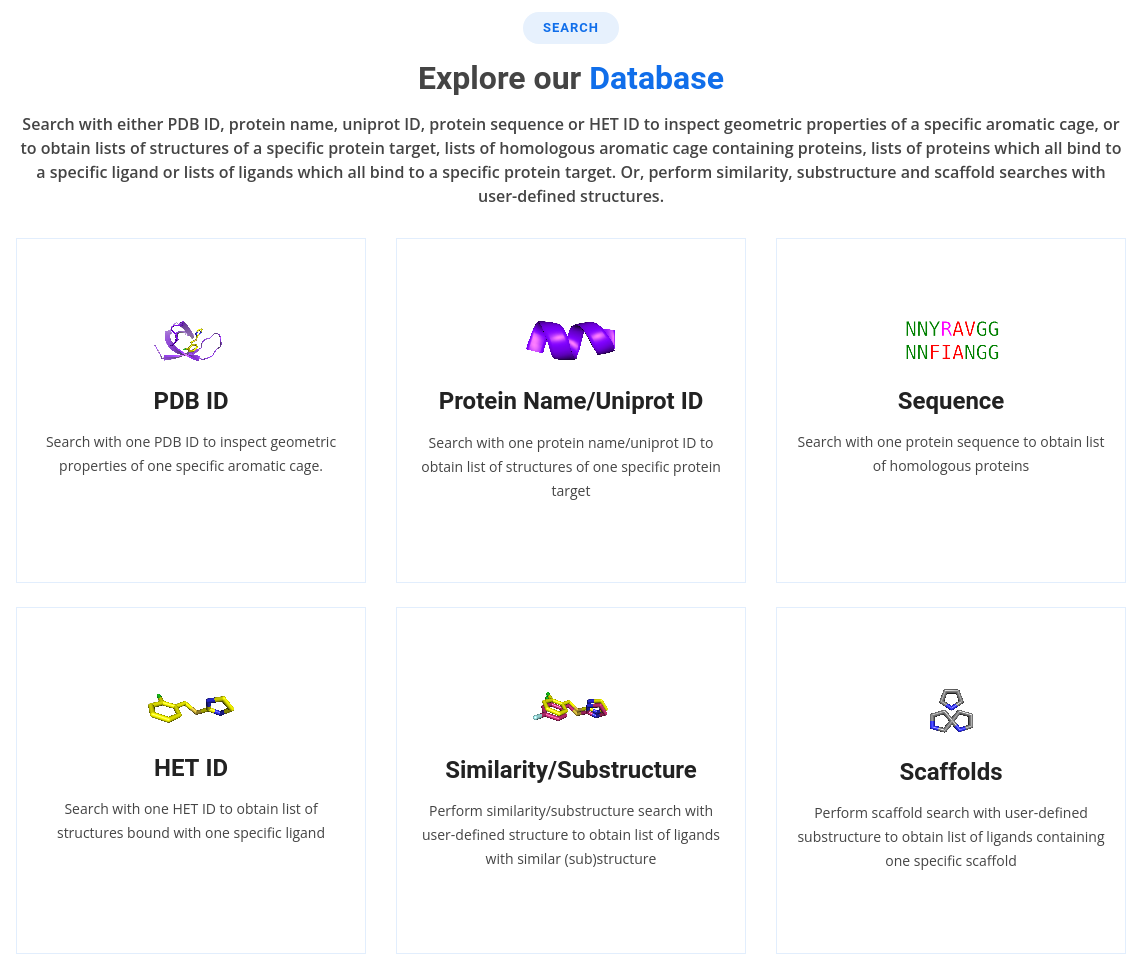
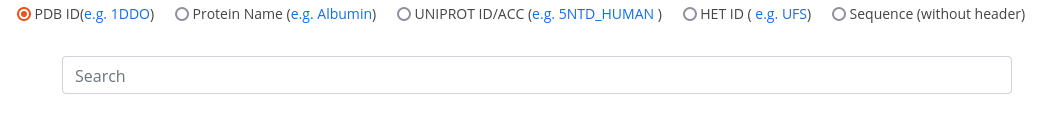
PDB ID
If you are interested in a given structure of a complex, click on the PDB ID icon on the homepage or Home -> Search -> Name/ID -> PDB ID, then type in the PDB ID and hit the 'ENTER' keyboard button.
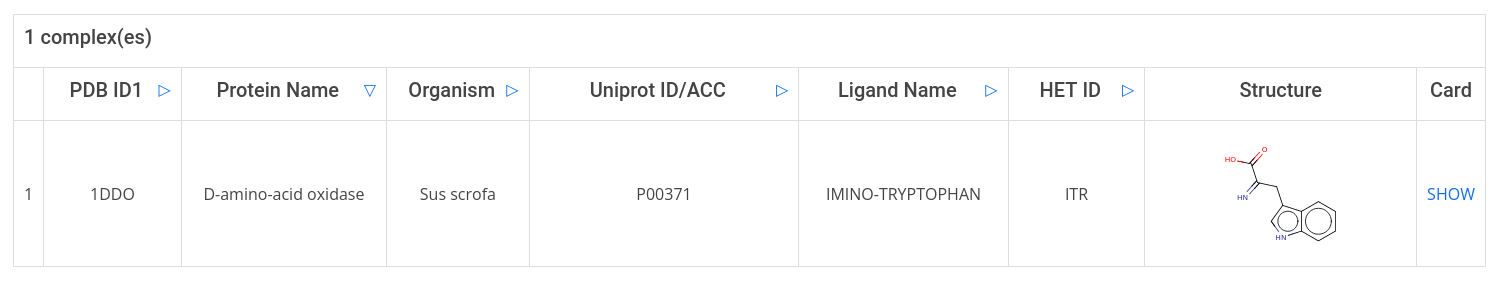
The search result table displays protein and ligand information related to the complex. To get more detailed information, click on show in the last column of the result table to open the complex card.
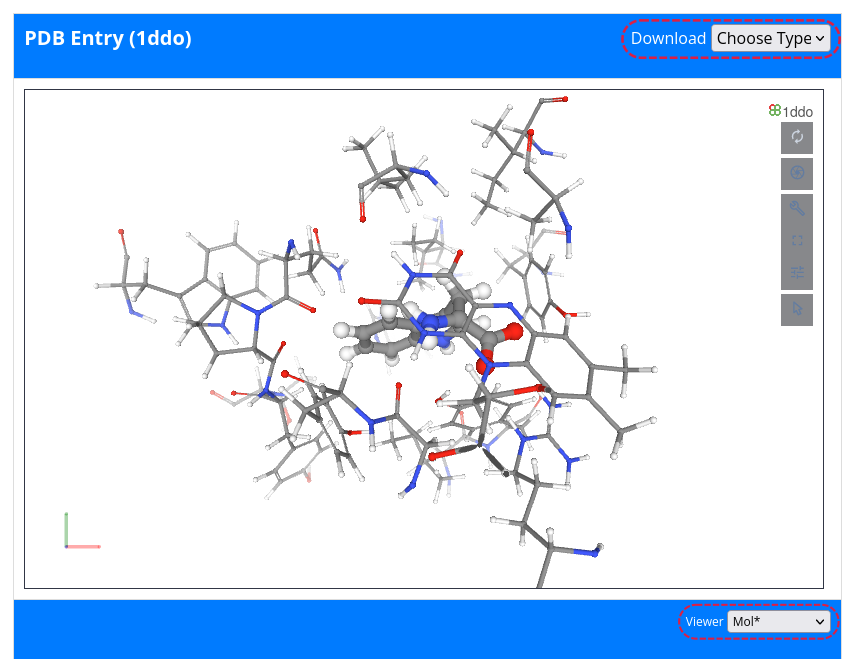
The complex card provides first a 3D structure visuallization with MichelaNGLo. Furthermore, the user can download a PyMOL session file (PSE) and open it with your locally installed PyMOL desktop program. To do so, go to Choose Type in the top right-hand corner and select PSE from the pull-down menu.
Below the visuallization window, the following information is displayed:
- about the complex, such as resolution, experimental method, and primary citation;
- about the protein, such as protein name, uniprot ID, source organism, protein class, gene, and gene ID;
- about binding pocket geometry, such as predicted volume, depth, hydrophobicity, druggability score, and pocket similarity;
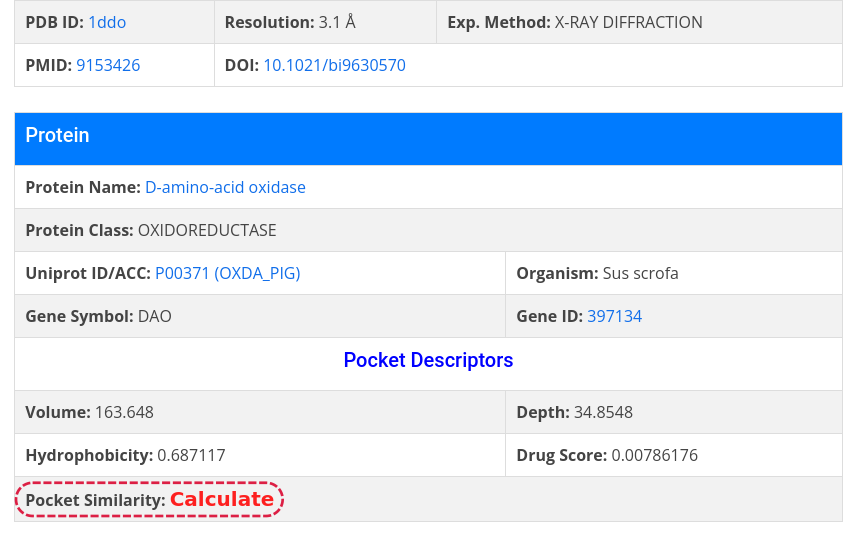
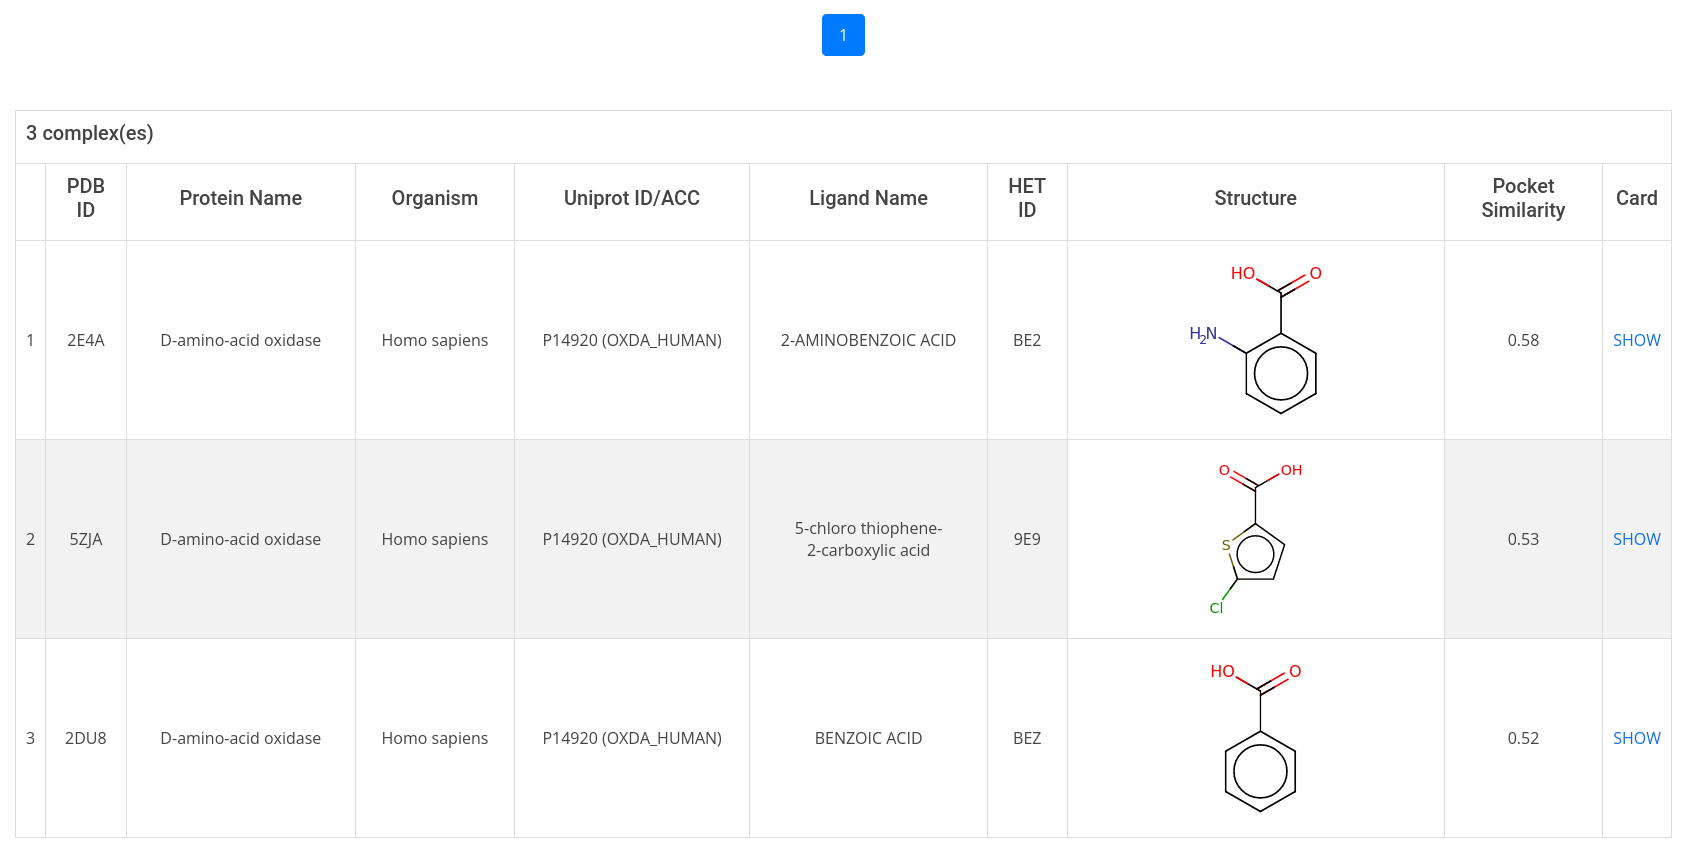
To get similar pockets, click on Calculate and the result table will display all pockets within AroCageDB with a PS-Score (pocket similarity score) above 0.4;
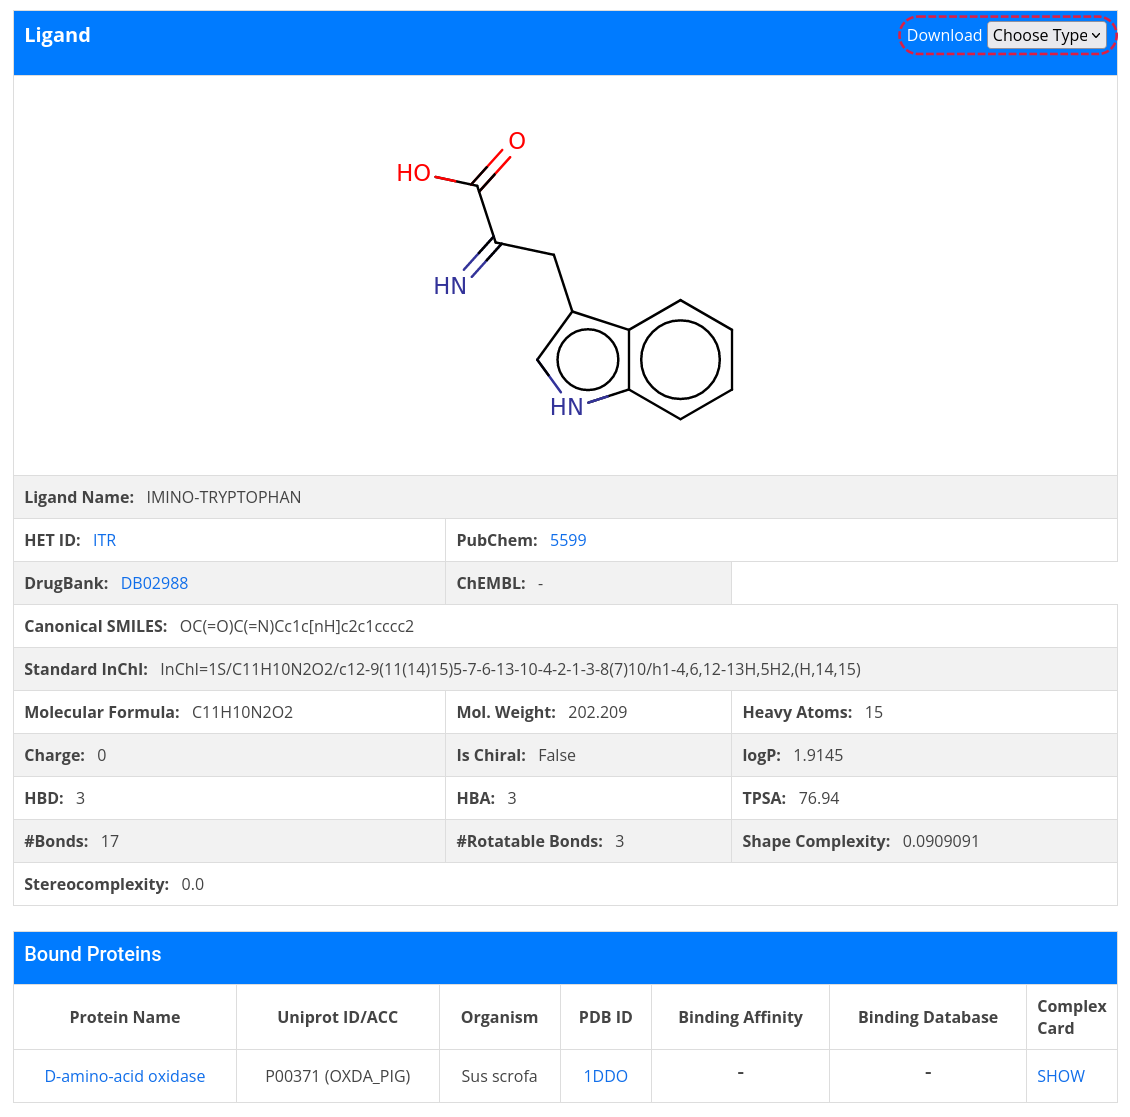
- about the bound ligand, such as 2D structure, HET ID, smiles, inchi, predicted physicochemical properties, external database IDs, among others;
- about the binding affinities;
The structural data can be downloaded by clicking on Choose Type in the top right-hand corner and select PDB/CIF from the pull-down menu.
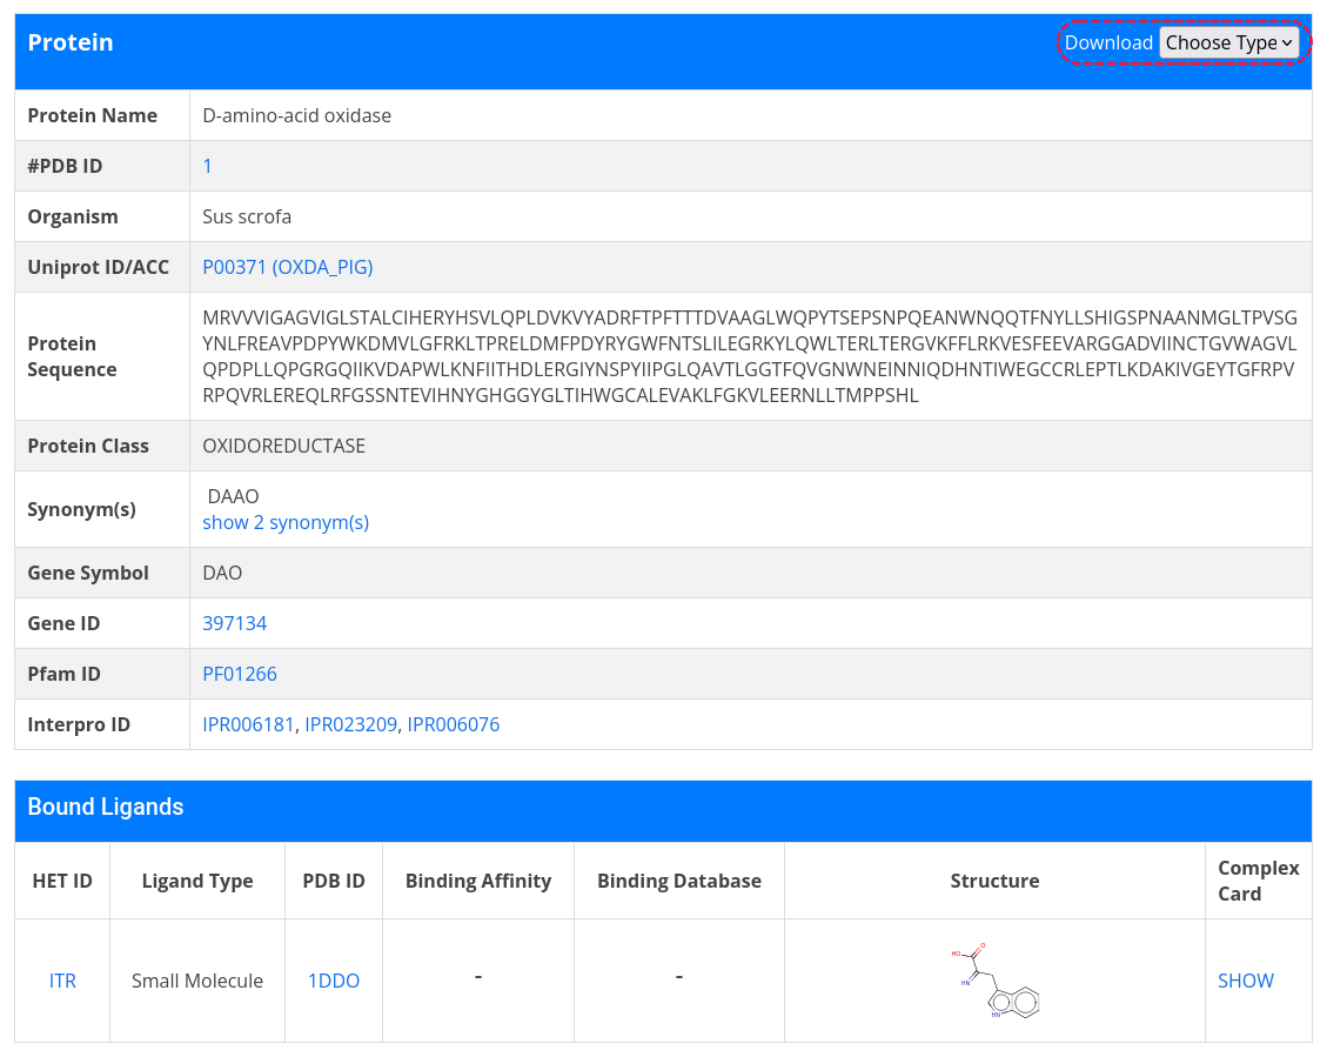
Furthermore, there is a possibility to access a protein card by clicking on a protein name. The protein card displays more detailed information about the protein, including protein sequence, Pfam ID, Interpro ID and a tabulation of all bound ligands and their binding affinities. To download the sequence data, go to Download in the top right-hand corner and click on Choose Type, then select FASTA
From the protein card, it is possible to go to complex card or ligand card. To do so, click on the show in the last column or the HET ID of the ligand.
Back to complex card, it is also possible to go to the ligand card by clicking on the name of the ligand. The result page displays more detailed information about the ligand, including a table containing all complexes of bound proteins available in AroCageDB. To download ligand structure file, click on Choose Type in the top right-hand corner and select SDF/MOL2 from the pull-down menu.
Similarily, it is possible to go to complex card or protein card by clicking on the show in the last column or the protein name of one protein.
It is also possible to browse through all structures in AroCageDB. To do so, click on the Complexes icon on the homepage or navigate to Home -> Browse -> Complexes.
Protein Name/Uniprot ID
If you are interested in a specific protein, it is possible to retrieve a list of structures of a specific protein target. You can either query by name or Uniprot ID of the target protein by clicking on the Protein Name/Uniprot ID icon on the homepage or Home -> Search -> Name/ID -> Protein Name or Uniprot ID, then type in the protein name or Uniprot ID
Sequence
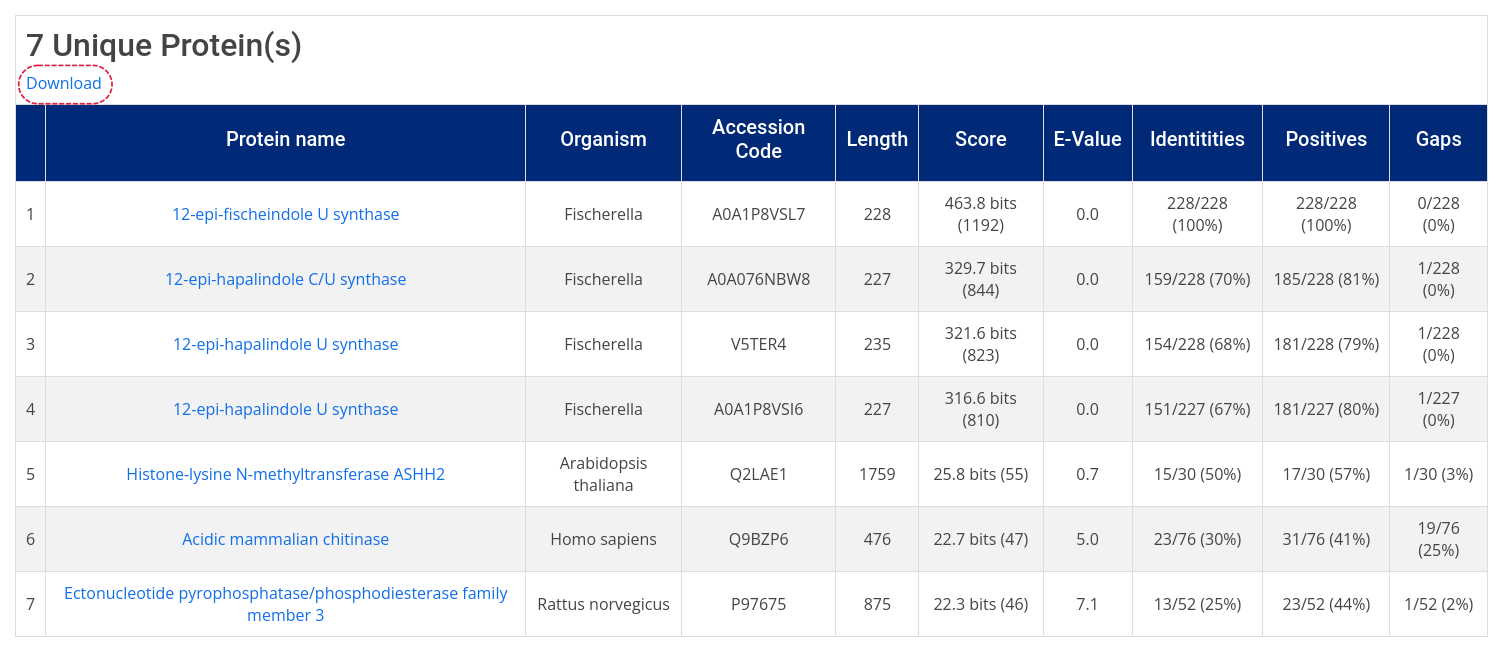
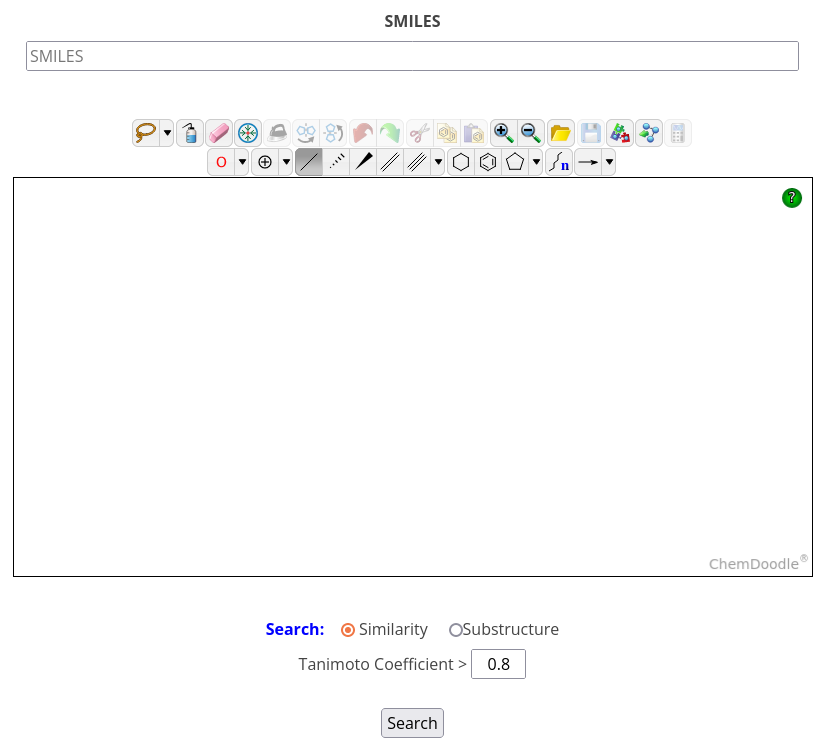
Sequence similarity searches in AroCageDB are conducted with the BLAST+ tool against AroCageDB. To do so, click on the Sequence icon on the homepage or navigate to Home -> Search -> Name/ID -> Sequence , then type in the protein sequence without header.
The search result page displays the ranking of the retrieved hits. In addition, alignments of the query to the hit sequences are displyed below the table and can be downloaded (as a TXT file) by clicking on the Download in the top left-hand corner.
HET ID
If you have interest in a given ligand and you know its HET ID, you can retrieve its list of bound complexes by clicking on the HET ID icon on the homepage or Home -> Search -> Name/ID -> HET ID, then type in the HET ID. The search result page is a ligand card.
Similarity/Substructure
Similarity and substructure searches in AroCageDB are conducted with RDKit using Morgan fingerprints. Fingerprints are dichotomous [0,1] (bit) arrays representing the structural features of a molecule. Rather than encoding concrete structural features like structural keys do, there is no assigned meaning to each bit. Fingerprints are generated from the molecule itself using hash algorithms. There are
- patterns for each atom,
- patterns for each atom, nearest neighbors, and respective bonds,
- patterns for each atom group and bonds for paths of up to two, three, ..., and seven bonds in length.
Subsequently, those patterns are generally encoded in four to five bits and added to the fingerprint. If patterns are substructures of another structure, all bits set in the substructure pattern's fingerprint will be set in the other's fingerprint. Boolean operations on those fingerprints provide an effective way for similarity calculations and substructure searches. Stereochemistry as well as atoms not connected to the "main" molecule are not considered in the kind of search AroCageDB perfoms.
AroCageDB uses the tanimoto coefficent for similarity calculations:
align="center">tcA,B=NA,B/(NA+NB-NA,B), with
- NA number of bits set "on" in fingerprint of molecule A
- NB number of bits set "on" in fingerprint of molecule B
- NA,B number of bits set "on" in fingerprint of both molecules (A and B).
To conduct a similarity/substructure search, click on the Similarity/Substructure icon on the homepage or navigate to Home -> Search -> Similarity/Substructure, then type in SMILES or draw a structure in the 2D sketcher.
Next, choose search type: similarity (with a Tanimoto coefficient cutoff) or substructure, then click Search. The result table displays the name, HED ID, and 2D structure of the hit ligands as well as the number of bound complexes. To get more detailed information on the bound complexes, click on the complex count in the last column of the result table to open a filered complex list and then, click on Show in the last column to display a given complex card.
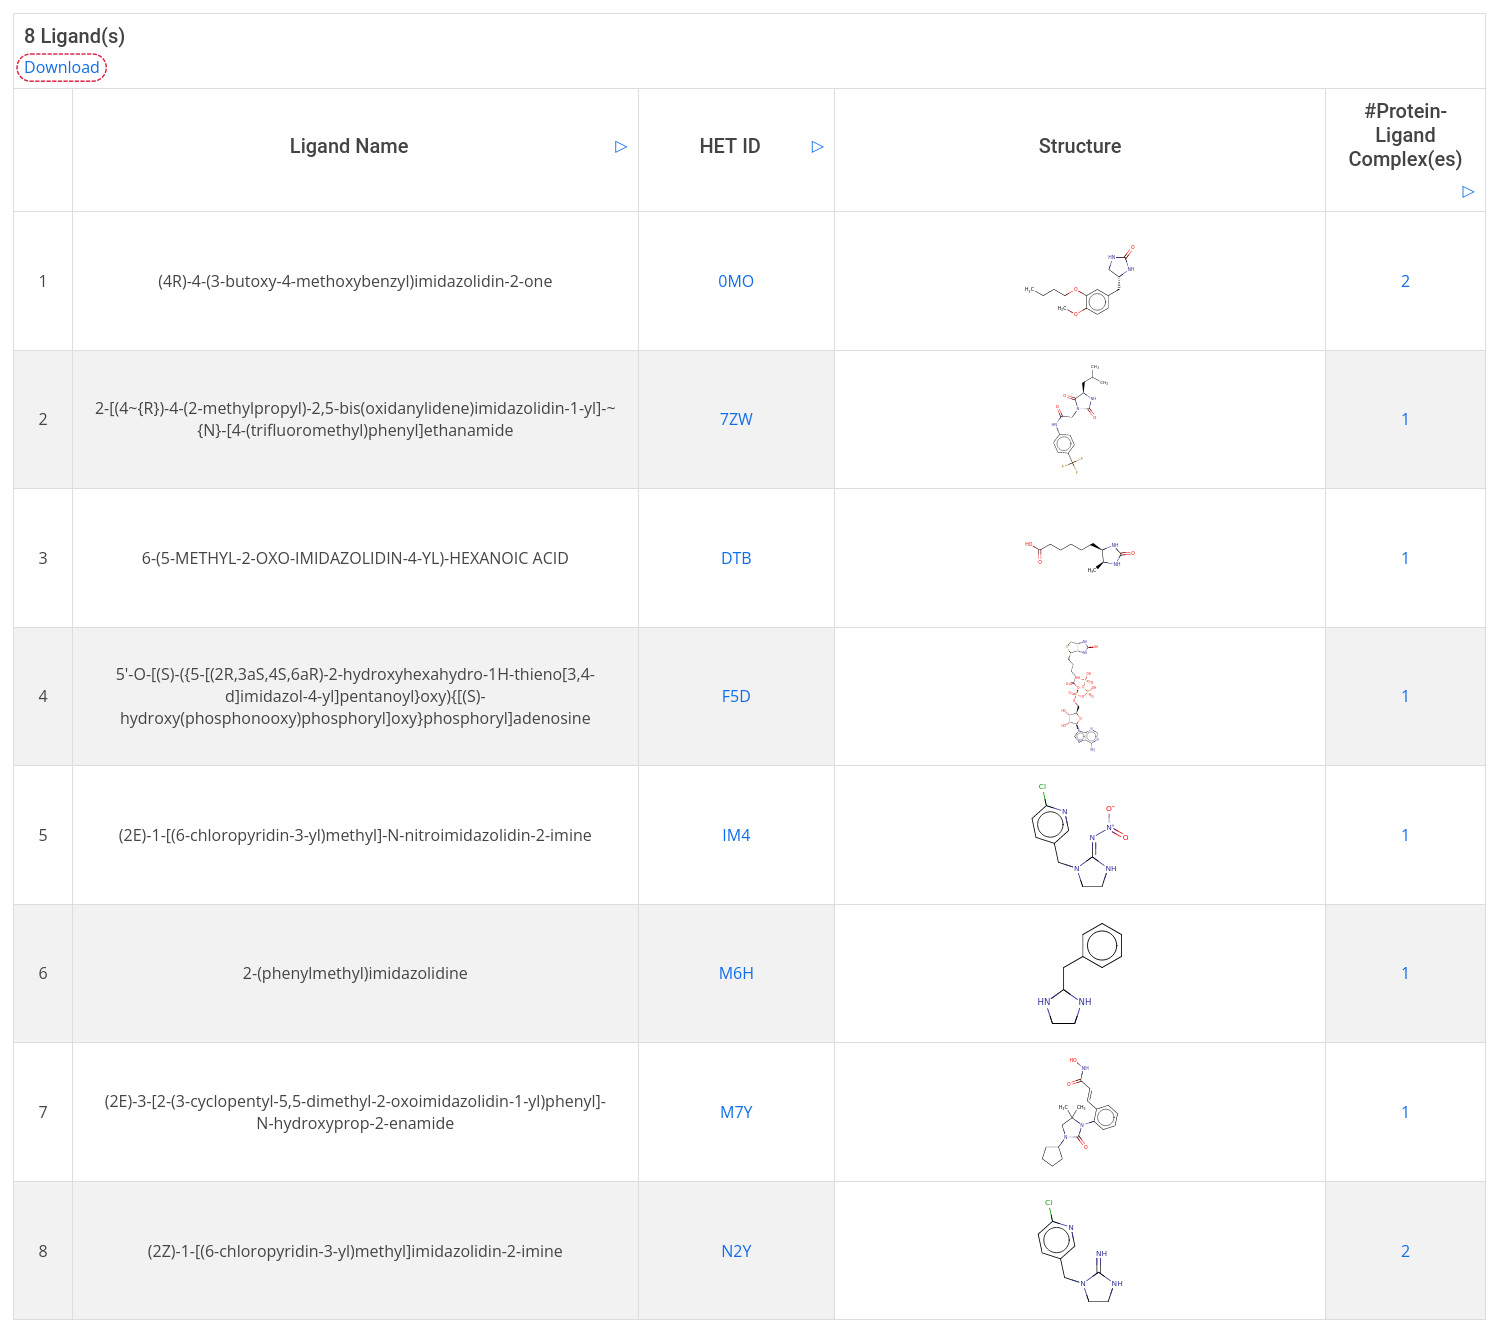
Furthermore, the search result can be downloaded as a CSV file including ligand name, HET ID, and canonical SMILES. To do so, click on the Dowload in the top left-hand corner.
Browse
AroCageDB offers four ways to browse and explore the archive. You can start browsing through by querying one of the four icons of the homepage or by navigating the Browse section of the task bar. All the Browse tables are sortable by each and every column, by clicking the arrow next to the column title.
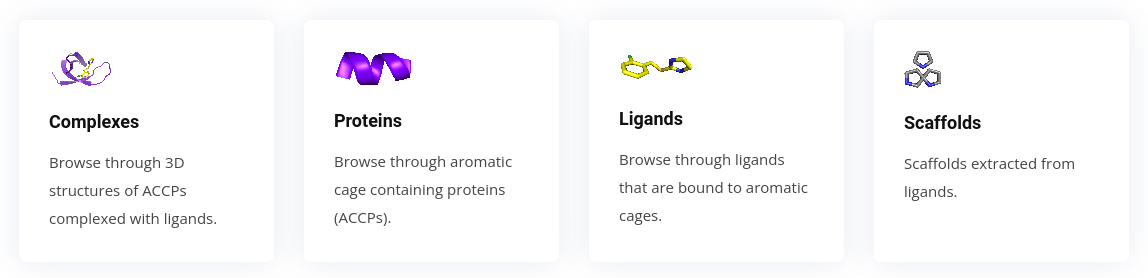
Complexes
Complexes can be browsed through directly. Click on the Complexes icon on the homepage or Home -> Browse -> Complexes. The result table shows all 3D structures of ACCPs complexed with ligands.
Proteins
The second browse option provides the possibility to browse through all proteins ordered by names, Uniprot IDs, or source organisms alphabetically, or by the number of complexes containing the protein. Just click on the Proteins icon on the homepage or Home -> Browse -> Proteins.
Ligands
Ligands can be browsed through directly. Click on the Ligands icon on the homepage or Home -> Browse -> Ligands. The result table shows all available ligands sorted by name or HET ID alphabetically, or by the number of complexes containing the ligand.
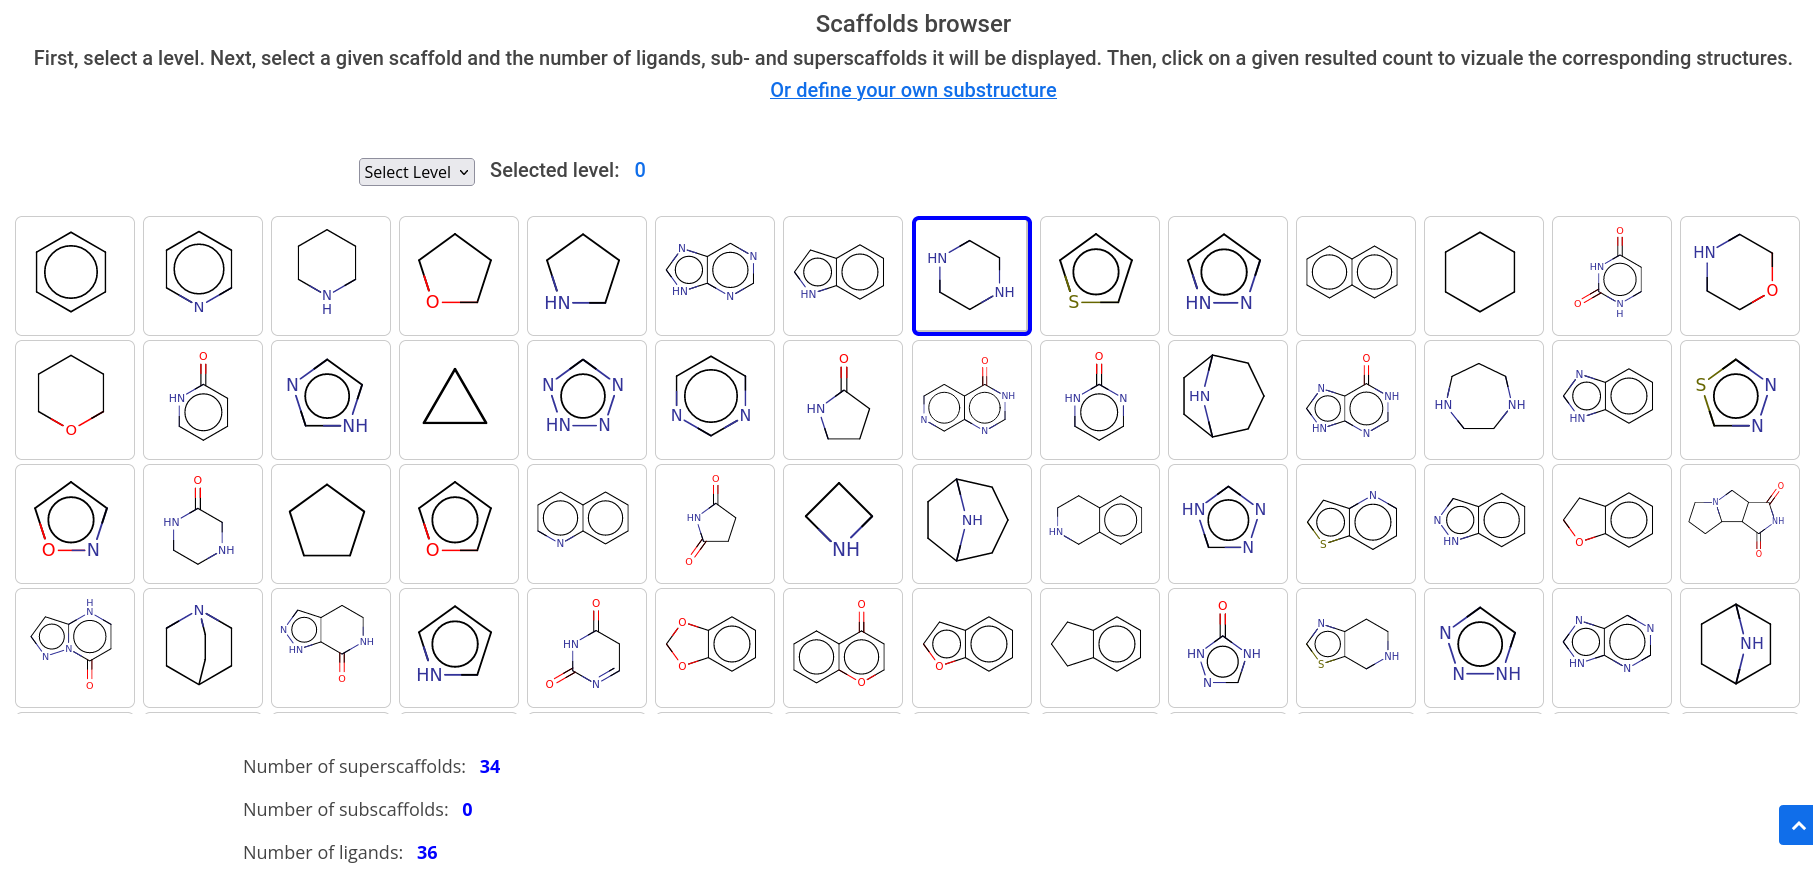
Scaffolds
Scaffolds can be browsed through directly. Click on the Scaffolds icon on the homepage or Home -> Browse -> Scaffolds. The search table shows all available scaffolds sorted by frequency of occurence, starting in scaffold level 0. After selecting one or more stuructures, you can either decide to browse through the next level of scaffolds containing the previously selected structures, or to show all related compounds.
What is shape complexity and stereochemical complexity?
The complexity of a small molecule can be rationalized by evaluating its saturation (shape complexity, Csp3/[Csp2 + Csp3]) or its total content in chiral carbon atoms (stereochemical or structural complexity, Cstereogenic/Ctotal). P. A. Clemons et al. PANS USA 2010, 107, 18787.
How pocket descriptors are calculated?
The geometric descriptors of aromatic binding sites, namely pocket depth, volume, hydrophobicity, and druggability score, were calculated with DoGSiteScorer, a grid-based program that uses a Difference of Gaussians algorithm for pocket detection and a support vector machine model for druggability assessment. Volkamer, A. et al. J. Chem. Inf. Model. 2010, 50 (11), 2041–2052; Volkamer, A. et al. J. Chem. Inf. Model. 2012, 52 (2), 360–372.
Why pocket descriptors on some complex cards are displayed as 'None'?
Pocket descriptor evaluation failed in a few cases for shallow, solvent-exposed binding sites (e.g. PDB ID: 6J2P; UniProt ID: SPP1_YEAST). Thus pocket descriptors for these complexes are displayed as 'None'.
Why some downloaded PyMOL session files (PSE) do not show pocket in mesh?
Pocket shown as mesh in PSE files are calculated with DoGSiteScorer, a grid-based program that uses a Difference of Gaussians algorithm for pocket detection. Pocket detection failed in a few cases for shallow, solvent-exposed binding sites (e.g. PDB ID: 6J2P; UniProt ID: SPP1_YEAST). Thus pocket in those PSE files are not displayed as mesh.
How pocket similarities are calculated?
We calculated the pocket similarity using the APoc program. APoc (Alignment of Pockets), is an efficient program for large-scale structural comparison of protein pockets. We used the default parameters in APoc, which gives p-values and z-scores for each binding site comparison. APoc Ref: Gao, M. & Skolnick, J.; Bioinformatics 29, 597604 (2013).
What are the different third party plugins used?
We have embedded commonly used third-party plugins into the website to increase the functionality, namely: Michelanglo (https://doi.org/10.1093/bioinformatics/btaa104) for the visualization of protein-ligand complexes; the command-line tool Molconverter (Marvin 20.18.0, 2020, ChemAxon, https://chemaxon.com/)for the depiction of 2D ligand structures, ChemDoodle (https://www.chemdoodle.com/) for structure editing, and RDKit (https://www.rdkit.org/)for similarity-based structure search, and BLAST+ (https://ftp.ncbi.nlm.nih.gov/blast/executables/blast+/LATEST/) for sequence similarity.
Whom should I contact with questions or suggestions?
Prof. Dr. Stefan Günther (stefan.guenther@pharmazie.uni-freiburg.de)
How do I cite AroCageDB?
Please cite:
Li J, Moumbock AFA, Qaseem A, Xu Q, Feng Y, Wang D, Günther S.
AroCageDB: A Web-Based Resource for Aromatic Cage Binding Sites and Their Intrinsic Ligands. J Chem Inf Model. 2021 Nov 22;61(11):5327-5330.
doi: 10.1021/acs.jcim.1c00927. Epub 2021 Nov 5. PMID: 34738791.